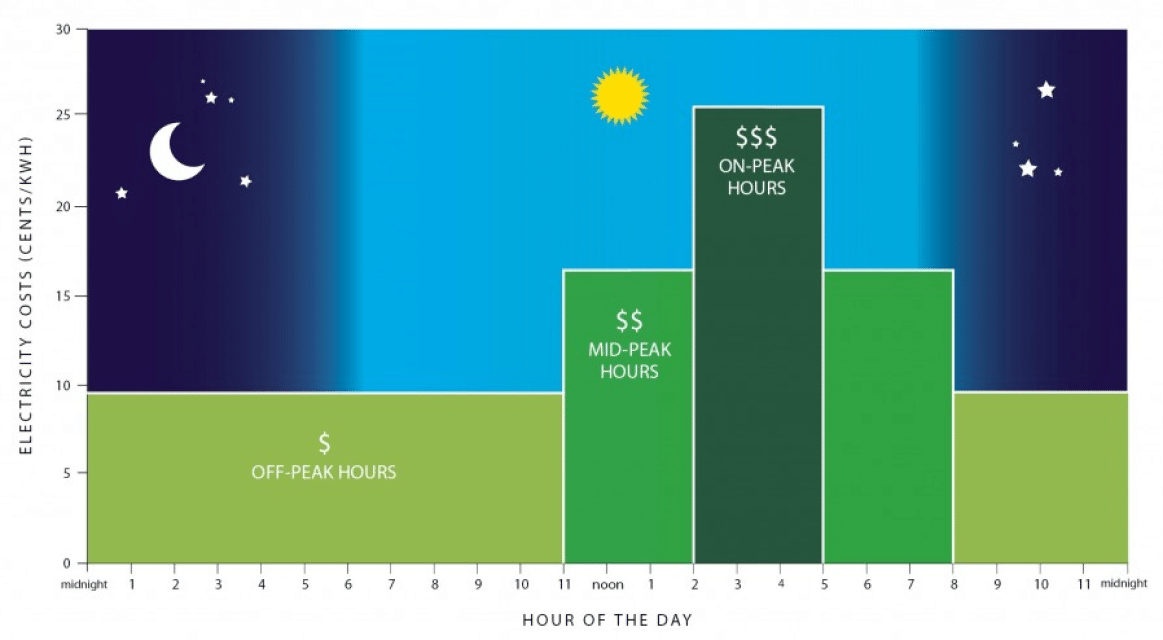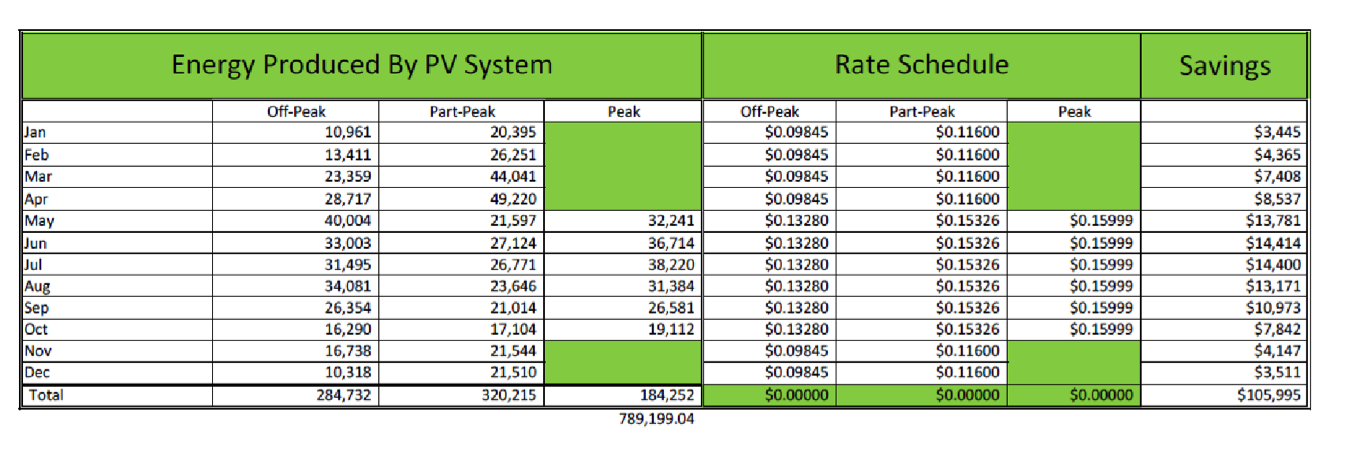
2016 is off to a great start in California with the extension of the Federal Investment Tax Credit and the California Public Utility Commission’s solar rate structure developments. California’s preservation of time-of-use rate schedules and power demand charges will yield beneficial results when sizing solar systems and performing a detailed analysis of interval data. To briefly define, interval data is simply a series of numbers generated to represent the level of power instantaneously being produced or consumed. Interval data is extracted from load and generation meters or can be simulated by computer programs such as PVsyst.
Generally, we think of interval data as being data representing fairly short intervals. The typical interval data used in the solar industry is the 1-hour interval, sometimes referred to as “8760” data because there are 8760 hours in a year. This is the hourly energy usage data that is collected from an existing PV system or from a solar production estimating software. Commercial rate schedules often include “peak-power” charges for maximum power demand. This data is recorded in 15-minute intervals by the utility. This introduces the need to analyze the 35,040 point (15-minute data) – which will be discussed further in the second part of this series – “Working With Interval Data with Combined PV/ESS Systems”
In the solar field, it is increasingly more important to show detailed financial savings versus system costs. With the decreases in system costs that we have seen over the last few years, a thorough analysis to show return on investment can help typical time-of-use (TOU) net metering projects sell themselves. TOU rate structures have a tendency to favor solar photovoltaic (PV) systems. This is due to the fact that energy that is delivered to the grid and net-metered will generally earn the system owner energy bill credits at the retail electricity rate when the electricity is delivered to the grid.
PV systems, by nature, produce more power when the price of energy is higher. Generally PV systems produce about 50 – 75% of the energy during the “peak” power pricing period and the remainder of the production happens in “part-peak” periods. Generally, the only “off-peak” production happens on weekends and holidays, depending on the technicalities of the particular rate schedule. This makes it possible for a PV system to offset a higher percentage of the electricity bill than the percentage of electricity it is producing.
The simulation of interval production data is the first step in performing a detailed and accurate cost/benefit analysis of a net-metered, time of use PV system. The next step is to separate the production numbers into bins according to the different times of use – or times of production in the case of a PV system when offsetting electricity and/or net-meter exported to the grid. The final step is to perform a 20-year financial ROI/payback period analysis using the financial benefit figures calculated in the previous step.
